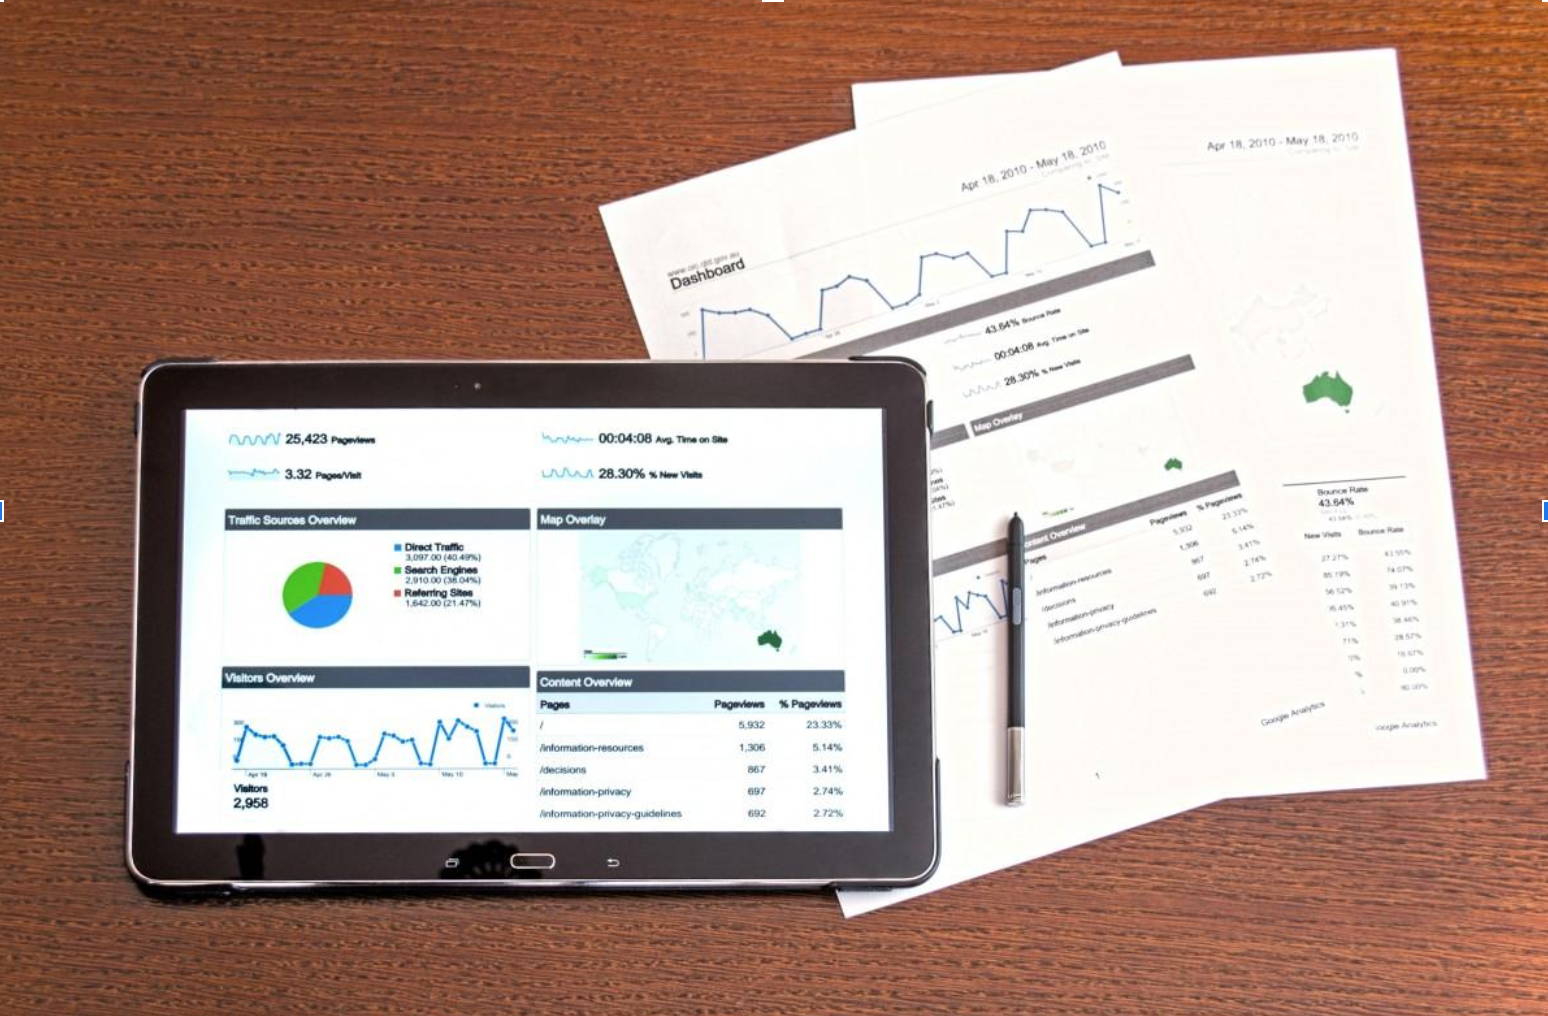
101 Guide to mobile app analytics

For any business with a mobile app, your work can only be complete when you master the skill of using analytics to influence action in a given direction. Here, we shall highlight some basic analytics tips that can help your business leap-frog to the next level.
Now, app analytics are only as good as implementing an action based on a given trend observed from the analytics. For example, if your analytics indicate to you that your users rarely visit a section of the app, you may want to see why users are disinterested in that particular section of the app.
The sole reason for doing this is to improve the user experience (UX) and also to try and make the section in question better. In extreme cases, the section in question could be entirely removed in the app’s next update.
Acquisition Reports
This is probably one of the most important pieces of the app analytics tools puzzle. It shows you how your users accessed your app and what their behavior is while there.
Sources Report: This feature of Google Analytics (GA) shows you exactly where your users enter your app from, how they navigate and how long they stay in your app.
Referral Flow Report: Once you link your Google Analytics to your Google Play developer console, you can view this valuable data. It shows you exactly where your app is performing well in terms of where you have high-value optimizations.
Similarly, it also shows you where your users are dropping. This way, you could gauge what could be causing the drop-offs and fix that.
Hour of the Day Reports: This metric enables you to determine what time of the day your users are most active in your app. With this data, you could know when to market your app with targeted in-app purchases and ads properly.
New Users Reports: Using this in your mobile app analytic tools, you get to know users who launched your app for the very first time and how their behavior was while in the app. You are also able to know the Operating System they are using, their geographical location and also the app version that they installed.
Behavioral Reports
These reports show the interaction of users and the app at all times. Among the metrics involved here are whether there are crashes within the app, navigation patterns in the app and whether users are getting value.
Screen Reports show the performance of each screen within the app. This includes total screen views, unique screen views and average screen views.
App Speed: This is the time that a user’s request takes to completely load. It is also a great metric in the analytics business as it shows you why people like or dislike your application.
In a fast-paced world, users would not spend the next second waiting for your slow app to load simple screens. They will quickly shift to the next available app which provides the same service.
Track the important
With the Google Analytics providing several metrics, you could be tempted to track everything. Instead of trying to digest every figure in the GA, you should identify some critical metrics that are helpful for your business.
Conclusion
If you have to move to the next level, a proper use of the app analytics will get you there. Knowing the right analytics is just not enough, however, important. Knowing where to tweak ensures you are responsive to the dynamic tastes of users.